
")
 Tiếng Việt
  Indonesia
  Português
This is a whole chapter about real trading. I will talk more about money management and trading psychology. Moreover, I will also share my personal experiences when trading with the strategy: Trend + Supply Demand zones.
Of course, since it is real trading, we will have a more meticulous way of entering orders. Please read chapters 1, 2, 3 that I wrote earlier for better understanding.
Register an Exness account NowGet $1,000 Free for beginners
Money management plan
I use an MT4 account to trade in Exness with total money of $30,000. My money management method is Risk/Reward (R:R) with 1R = $600 (2% rule). So each trade I can only lose up to 600$.
To calculate trading volume, you can do it with Lot size calculator.
For example, I enter a GBP/JPY order with 120 pips stop loss => My trading volume will be 0.55 lots.

BUY GBP/JPY order
I analyzed the market based on the daily chart. After identifying the Uptrend and the Demand zone, I started waiting for the price to retest and react at this Demand zone with a stop-decreasing candlestick. This was the signal for me to open a BUY order.

As soon as the signal candlestick closed, I entered a BUY trade:
- Stop Loss (SL): 120 pips. SL level will be below the Demand zone.
- Take Profit (TP): 240 pips. So, ratio R:R = 1:2.
- Trading volume: 0.55 lots.

Result: Won 2R profit.

SELL XAU/USD order
In the daily chart, the gold price was in the downtrend and created a Supply zone. The market showed signs that the price was going to rebound and retest this Supply zone. My job was to wait for the reversal signal.

SELL Gold as soon as the price closed with 1 Doji candlestick.
- SL: 250 pips right above the Supply zone
- TP: 400 pips at the old trough.
- Since the stop loss is quite far, I chose a safe trading volume with 0.24 lots (2% rule).

Result: The SELL Gold order won and earned more than 1.5R profit.

SELL USD/JPY order
It was still the same scenario with the USD/JPY. The price has been in the process of decreasing and created a supply zone. When it retested at this zone with a Bullish Pin Bar candlestick, I opened 1 SELL order.
- SL: 40 pips. Set above the Supply zone.
- TP: 100 pips. I expected the price to drop to the old trough. R:R = 1:2.5.
- Trading volume: 1.6 lots.

Result: SELL USD/JPY order has not touched TP yet (at the time I wrote this article), but it was winning more than 2.5R profit.

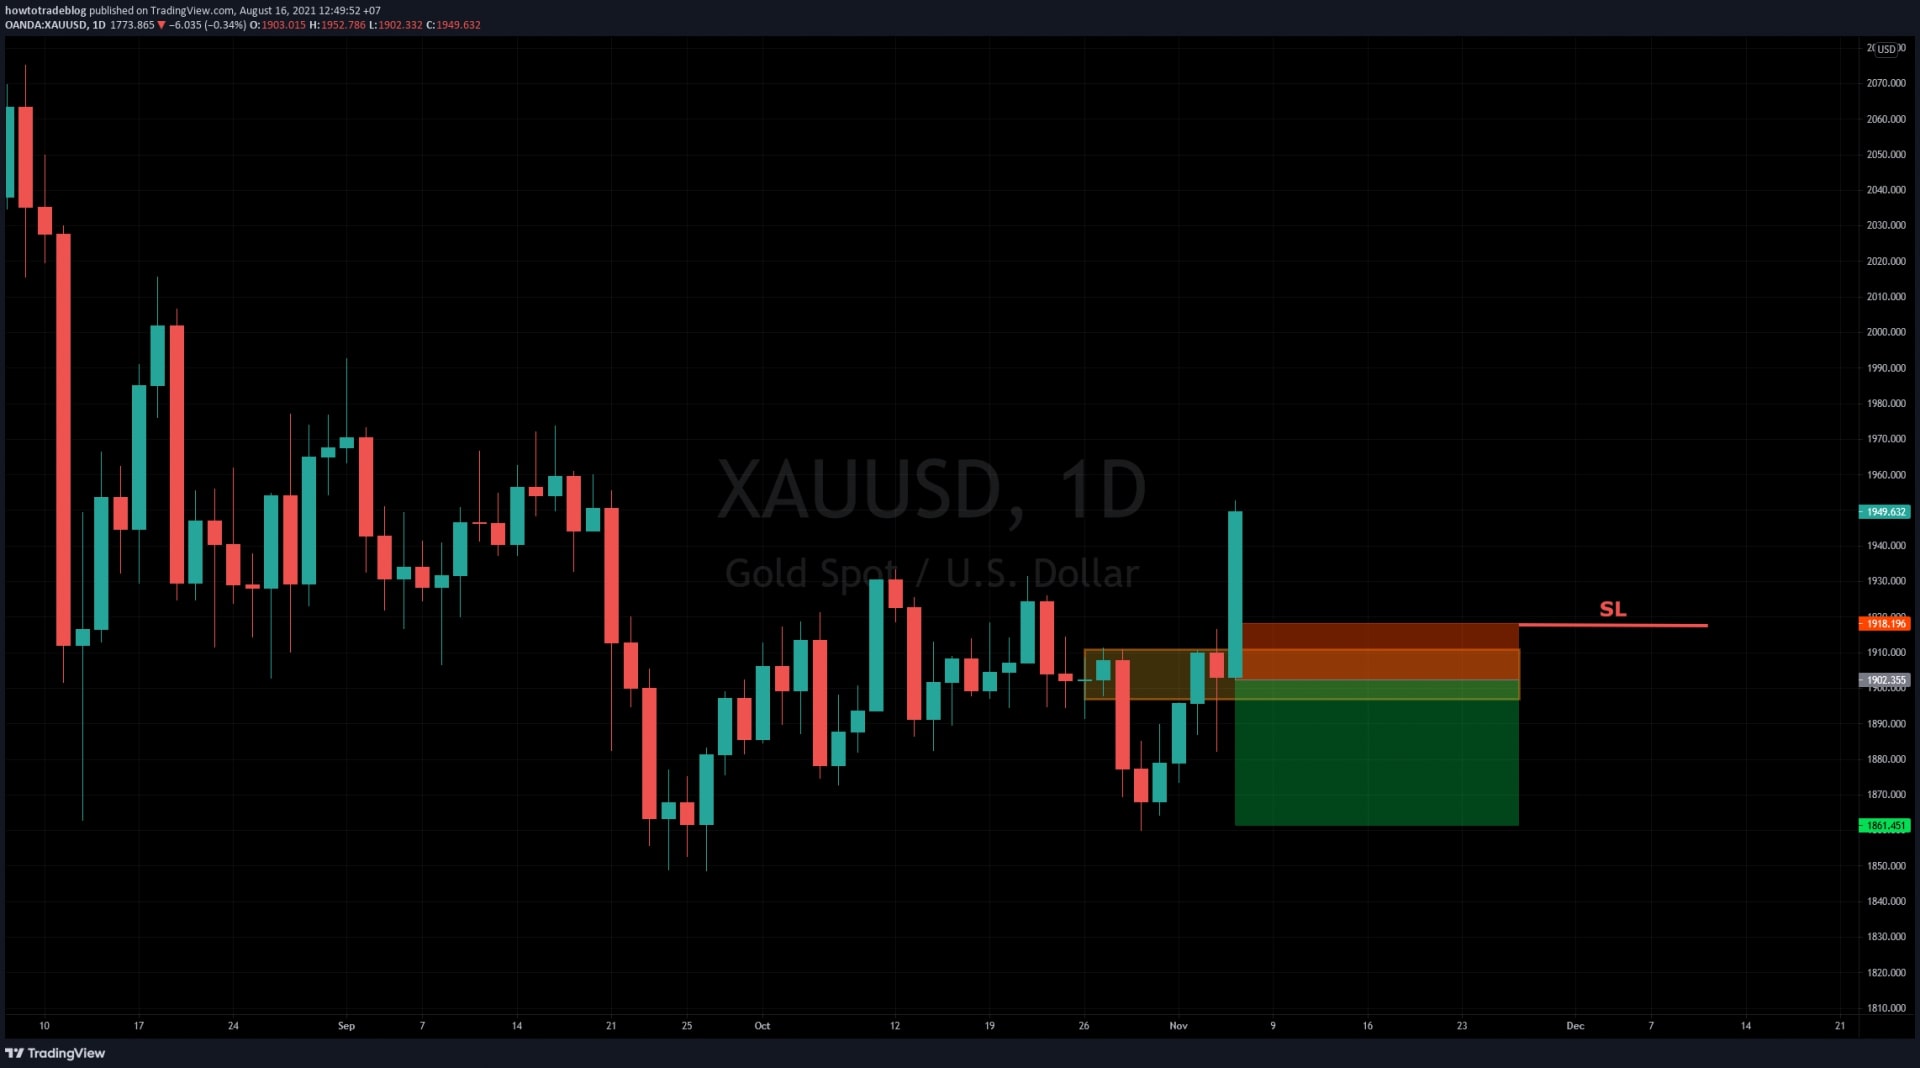
Another SELL XAU/USD order
This is one of the losing trades that I could hardly forget. The gold price was in a downtrend and it entered the Supply zone. After it created a reversal signal with a nice red candlestick, I placed a SELL order.

Result: The order hit SL because the price suddenly flew like a rocket. The market is always like that. Sometimes everything goes smoothly as theory but the result isn’t what you expect.
Real trading experiences
Above are some of the real trading orders that I still keep the history. So, I share the timeline and the reason I place them. Now let’s talk about the advantages and disadvantages of this strategy.
Daily chart analysis
My experience shows that the Supply and Demand zones are more reliable than other chart types when using the daily chart. Signals such as reversal candlesticks, Doji candlesticks on the daily chart give greater safety.
In particular, when using the chart daily for analysis and trading, I don’t get caught up in unexpected price movements of the market. Although the number of trading orders is small, the win rate is quite high.

Another advantage of using a daily chart is time saving. It does not take you too much time to analyze. Just identify the trend and Supply Demand zones on Gold or major currency pairs. The rest is waiting for the market to react there. In my free time, I will do other things like writing and translating this article to share with you.
Money management element
The trading strategy helps you know the entry point, where to set SL and TP, etc. Therefore, you can easily calculate the risk factor for each transaction.
However, in my opinion, money management is more important than the trading method. If you have a good way to control the flow of money, your mind will be calm even when you lose many orders. Almost all people know the strategy but only those who can control their emotions win in the market. That’s why right from the beginning I mentioned money management first. Hope you will understand what I want to convey.

Profit taking psychology
Stop Loss for each order is 2% of the account. If you do it well, there is nothing to worry about. But the problem now will be waiting for the price to move to the take profit zone. I call this “the profit taking psychology”.
If a person’s mind is weak and afraid of losing, he or she can close the order soon when the price has only gone half of its way. That’s still okay but it’s not worth the time you spend waiting for that order.
A long way to go
Sometimes I can only trade 1 order a week but that’s not a problem for me. I come to this market to learn how to survive and make long-term profits. Therefore, my priority is to keep the money safe.
If you follow this strategy, sometimes you will find it quite boring and feel a bit “greedy” when you see many other traders earning more than you. Everyone has their own trading style. If you choose to go slowly, safely and sustainably, this strategy is right for you.

Summary
I would like to close the trading series based on Supply and Demand zones in this article. If you’ve read all four chapters, you can test this trading system on any platform like Tradingview, MT4/MT5. But don’t get cocky after winning in the demo account. It is very different when you trade with your real money.
Let’s practice and make it your own trading experience. Thank you and see you again in the next articles.
")
")
")

 General Risk Notification: trading involves high-risk investment. Do not invest funds that you are not prepared to lose. Before you start, we advise that you become familiar with the rules and conditions of trading outlined on our site. Any examples, tips, strategies and instructions on the site do not constitute trading recommendations and are not legally binding. Traders make their decisions independently and this company does not assume responsibility for them. The service contract is concluded in the territory of the sovereign state of Saint Vincent and the Grenadines. The services of the company are provided in the territory of the sovereign state of Saint Vincent and the Grenadines.